A case study and tutorial on using the NetBeans profiler to profile Ruby code running on the JVM via JRuby. Walks through the steps of configuring NetBeans, launching JRuby with profiling settings, connecting NetBeans to JRuby, and analyzing the results.
NetBeans IDE for Java includes a Java profiler. I like using this to profile JRuby code, though it took me a while to get the hang of things and extract useful information.
Setting up NetBeans
Export Remote Profiling Pack (Only needs to be done once)
After installing NetBeans, the first step is to set export the “remote profiling pack” so we can use the NetBeans profiler in “remote” mode. Even though NetBeans and JRuby will both be running on the same machine, I find “remote” mode the most convenient method: start JRuby with some special Java options, direct NetBeans to connect, then gather profiling data.
Start NetBeans and select Profile -> Attach Profiler.... If the
Attach Wizard does not appear, click the change link to change the
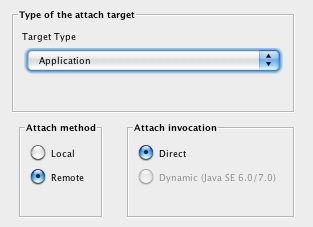
Attach Mode. Select Application with Remote and Direct options.
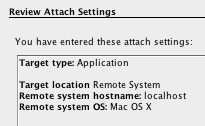
Click Next to move to the Remote System page. Set to “localhost”.
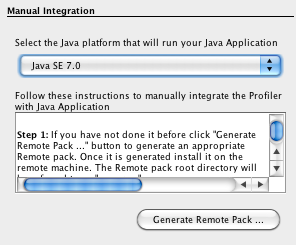
Do not click Finish; instead, click Next to move to Manual
Integration page. Choose “Java SE 7.0” and click Generate Remote Pack. Save the resulting file somewhere such as
$HOME/netbeans/remote-pack. Unzip the resulting file:
~/netbeans/remote-pack$ unzip profiler-server-mac.zip
Configure for Remote Profiling with JRuby filter
Now the Attach Profiler dialog should be configured to profile a “remote” application running on localhost. Sampling mode is best to start out with. NetBeans will periodically sample the stacks of all threads, recoding the stacktraces. It can only make estimates of the timings and counts of method calls, but this is often good enough and is far lower overhead than full Profiling which modifies Java bytecode to add instrumentation.
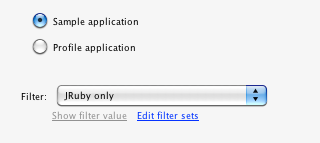
Click Edit Filter Sets and add a new filter. Set the type to
Inclusive, and click Edit Global Filters to create a filter that
applies to org.jruby., rubyjit.. This will limit profiling to Java
classes in these packages. JRuby internals and JRuby running as an
interpreter will be using mostly org.jruby.. When JRuby JIT compiles
Ruby code into Java, this will appear under the rubyjit. package.
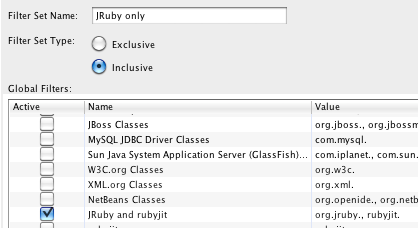
At this point we’ll leave NetBeans until we have our ruby code ready to profile.
Running JRuby with Profiling Options
To use the NetBeans remote profiler, Java must be started with
commandline options to hook in the NetBeans remote pack code into the
JVM startup. The options are
-agentpath:$agentpath=$remote_pack_lib/lib,5140 where $agentpath
is the path to the appropriate file inside the remote pack (varies by
platform), $remote_pack is the path to the lib directory in the
remote pack, and 5140 is the TCP port on which to listen (NetBeans’
default is 5140).
Since JRuby will read the JAVA_OPTS environment variable
and apply them to the JVM, a small shell script can be used to wrap
JRuby invocations, called netbeans-profile
#!/bin/sh

remote_pack_lib="$HOME/netbeans/remote-pack/lib"
agentpath="$remote_pack_lib/deployed/jdk16/mac/libprofilerinterface.jnilib"
opts="-agentpath:$agentpath=$remote_pack_lib,5140"

export JAVA_OPTS="$JAVA_OPTS $opts"
exec "$@"
If this script is on your PATH and made executable, you
can launch JRuby like this to start a profiling session:
netbeans-profile jruby -G -S rake assets:precompile
The -G instructs JRuby to load Gemfile. Note that using bundle exec will not work correctly since two JVMs are launched: the first
to set up the gem environment, and the second to run the actual JRuby
command.
With the NetBeans profile options in place in the JVM, you should see something like this:
$ netbeans-profile jruby -G -S rake assets:precompile
Profiler Agent: Initializing...
Profiler Agent: Options: >$HOME/netbeans/remote-pack/lib,5140<
Profiler Agent: Initialized successfully
Profiler Agent: Waiting for connection on port 5140 (Protocol version: 12)
The JVM is waiting a connection from NetBeans, so lets return to NetBeans and start a profiling session.
Profiling in NetBeans
Start NetBeans and select Profile > Attach Profiler.... If you followed the steps above, it should
already be configured to profile a “remote” application running on
localhost. Make sure the filter options are set to your taste, then
click Attach. The JRuby command that was paused waiting
for NetBeans should now proceed.
While the program is running, you can click Take Snapshot to
snapshot the profiling data acquired thus far. This is most useful in
long-running sessions like testing a Rails application. Or, if you
wait until the JRuby command has exited, NetBeans will offer to make a
snapshot at that point.

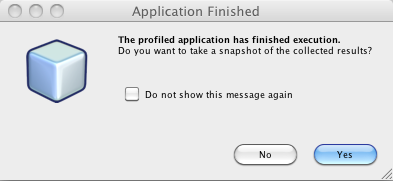
With a snapshot loaded, NetBeans will show the Call Tree view. This is
a list of all Java threads that were seen along with a tree of method
calls. Switch to the Hot Spots view and sort by Self Time (cpu). In
the example, java.lang.Thread.getStackTrace() is consuming 20% of
the time and has been invoked 2588 times. But this fact doesn’t do
much good since that method is out of our control. We need to know
what methods are resulting in eventual calls to getStackTrace().

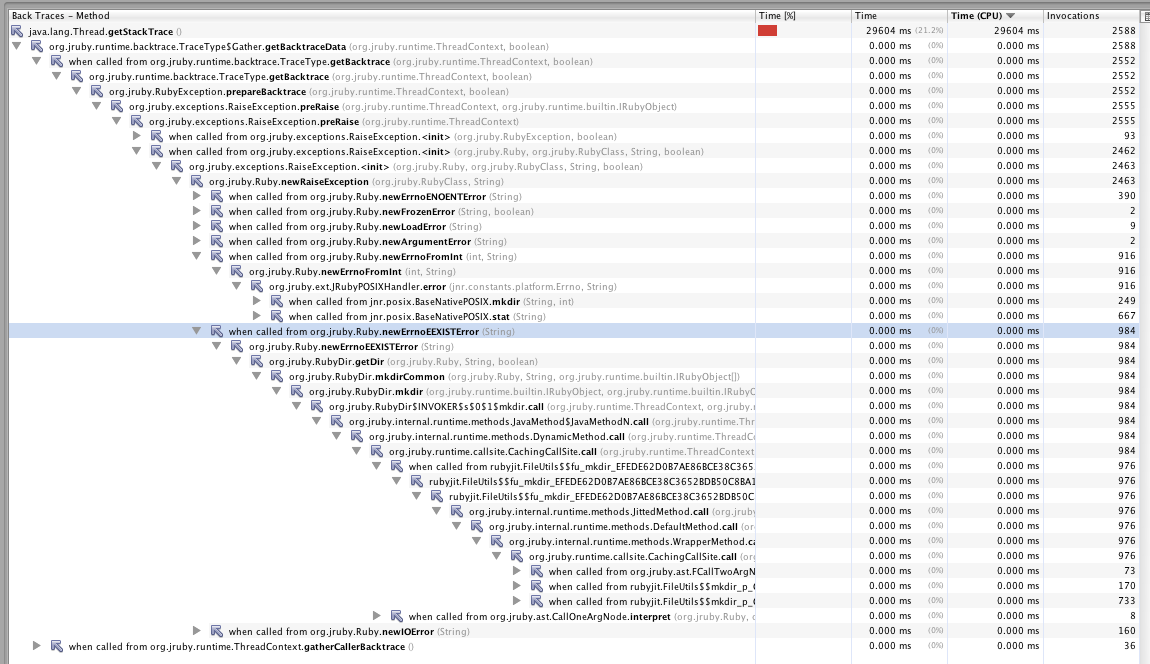
Right-click on the getStackTrace() line and select Show Back Traces. This will open an overwhelming view of all code paths that
lead up to calls to getStackTrace().
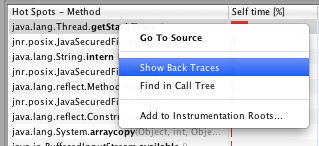
Looking at rubyjit method calls in the profiler, it is usually very
easy to determine which Ruby method is being called. However, in the
Java side there are a few Java method calls in between each Ruby
method call. This makes digging through a large tree of back traces a
little tedious.
Nevertheless, we soldier on. Notice how the number of invocations on the right column starts at 2588 and then at a point, falls to 93. This indicates that those portions of the tree are responsible for only 93 of the 2588 total invocations. Collapse that portion of the tree for now, since it is less important than the biggest offenders.
By expanding or collapsing the tree at the points where the invocation
count drops off, we can zoom in on a section responsible for 984 of
the 2588. Zooming down further, we finally see familiar looking method
names such as rubyjit.FileUtils$$mkdir_p.... This is a JIT’ed method
from FileUtils.mkdir_p.
Notice above that the method org.jruby.ast.FCallTwoArgNode.interpret
is responsible for 73 invocations. This is JRuby acting as an
interpreter before it has JIT compiled the method. To avoid
interpreter calls cluttering up the profile (the Java profiler cannot
know what Ruby method was being called), JRuby can be
configured to compile everything upfront, or in a long-running app you can
simply wait for a time to allow the JIT to work automatically.
Finally, we can peek inside the code for FileUtils to see why it might be triggering exceptions. Obviously, the means of improving performance may vary drastically from codebase to codebase. In this particular case, several bits of Ruby including FileUtils use exceptions for flow control where, at least during an assets precompilation run, the exceptional cases are common enough to take up a large portion of the time. See Comparing Ruby exceptions to additional stat() test for more details on that particular issue.
